
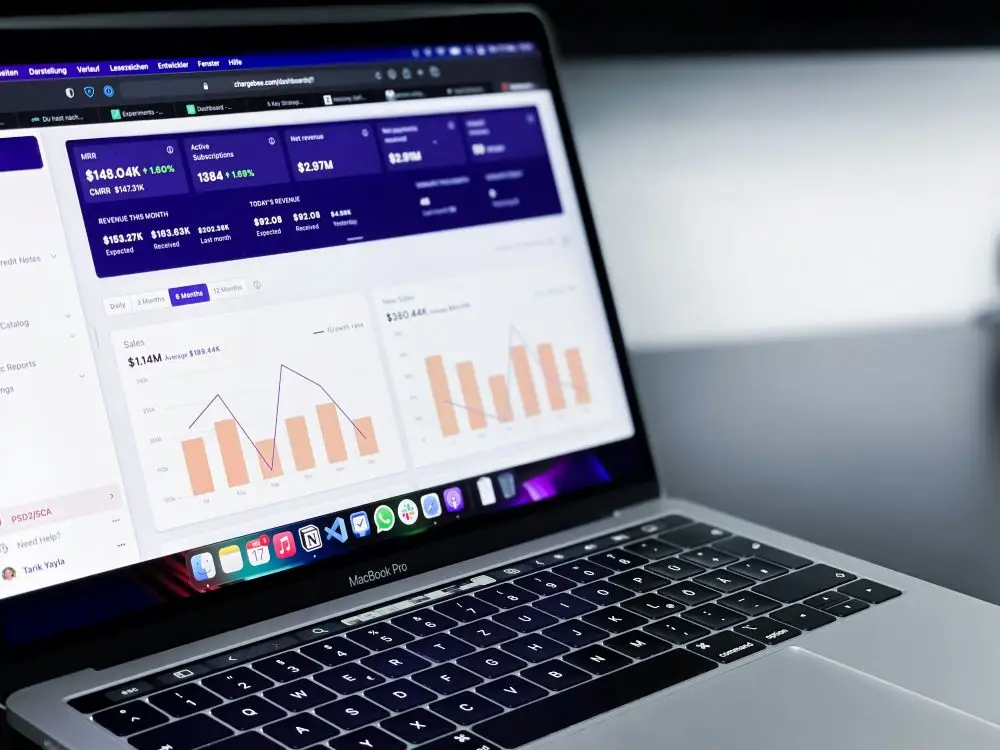
A dashboard for industrial automation
PQH Holding SA wanted to create a financial monitoring service to better manage the group's financial movements and business results. The project was initiated with CETEC, a subsidiary dedicated to building automation, as a pilot project before a broader rollout across the group.
- Published on
In a few figures...
8
8 branches to address in the long term
The dashboard designed for CETEC was intended to become a reusable model for all the group's subsidiaries.
2weeks
JEMS delivered a first prototype in two weeks, followed by the full Power BI report in two months, following a Lean approach focused on speed and efficiency.
3
Power BI views
The report has been structured around three views to clearly address COMEX's expectations for indicators and functionalities.
The project
Our approach
JEMS combined a DataViz and UX approach to design a more useful, readable, and rapidly deployable steering tool. The project began with an audit of existing Excel reports and discussions with the executive committee, followed by a scoping phase with end-users to design a Power BI dashboard suited to their needs and simple enough to be duplicated for other subsidiaries.
The diagnosis
PQH had existing reports in Excel, but required a more robust, legible management tool that was better aligned with the expectations of the executive committee. Beyond visualisation performance, the project also had to meet a strict requirement for speed of deployment and prepare for a group-wide duplication strategy. Therefore, a dashboard needed to be created that was both useful for CETEC, simple to use, and sufficiently structured to serve as a basis for other subsidiaries.
The key deliverables
- Review of existing reports and gathering of COMEX expectations
- User interviews and user story creation
- Creating personas to better define end-user scenarios
- Facilitation of two sketching workshops with the Product Owner and users
- Wireframe design for the dashboard
- Creating a prototype integrating the graphic charter in Power BI
- Delivery of a structured report in three views under Power BI
- Support for getting started to facilitate duplication by other subsidiaries
How can PQH create a Replicable financial dashboard To better manage its subsidiaries?
The benefits
More readable control
The new dashboard allows for a clearer reading of financial movements and business results.
A response tailored to the COMEX's expectations
The indicators and functionalities were defined based on the needs expressed by the group's decision-makers.
A rapid handover
The Lean approach allowed us to obtain a prototype in two weeks and a complete report in two months.
A user-focused experience
Interviews, personas, workshops, and wireframes allowed us to design a more useful tool for real-world use.
A group-scalable duplicable model
The dashboard has been designed to be taken over by the customer technical service and adapted for other subsidiaries.
The 6-step approach
1. Audit the current situation
JEMS has analysed the Excel reports already in use and gathered the COMEX's expectations regarding indicators and features.
2. Understanding end uses
Interviews and user stories have helped to better understand user needs, usage constraints, and their environment.
3. Structure the target experience
The creation of personas, sketching workshops and wireframes served to quickly build the foundation for the future dashboard.
4. Prototype rapidly
A first prototype integrating the graphical charter was created in Power BI to quickly validate design choices.
5. Deliver the final report
The final dashboard has been structured into three Power BI views to precisely meet the client's management expectations.
6. Prepare for duplication
JEMS supported CETEC with the handover to enable the client to reuse the report's design and logic across other subsidiaries.